Data analytics
We work with organisations to enhance their existing analytical capability.
33n brings extra experience and expertise to the transformation and visualisation of data. We take a strong collaborative approach to our analytical work to ensure the organisations we work with achieve the best possible analysis and gain genuinely meaningful insights.
Analysis and modelling
Our healthcare applications give users access to a suite of interactive visualisations and modelling tools for fast and flexible insights that enable detailed activity and workforce modelling. We provide comprehensive tools for you to accurately map your current service delivery, spot where improvements could be made, and then use that information to create a detailed plan of how to deliver them.
Our secure portal is set up to capture patient data that is then cleaned, mapped and transformed to allow deeper, granular insights into the way services are used and care is delivered. This allows you to automate and streamline data processing and your decision-making process. Complementing this, our dashboards allow you to visualise existing data to explore the insights more fully and create hypothetical future scenarios.
In this way, you will be able to accurately assess the impact of proposed changes to the delivery of services and the structure of your workforce.

Data analytics case study
Gloucester Care Services NHS Trust,
Community hospital analysis
The challenge
33n were commissioned to analyse the demand for stroke-specific support in community hospitals and recommend the number of beds required for a new, dedicated stroke unit.
The approach
Our clinically active doctors and analytics team worked closely with management and NHS business intelligence to link and validate problematic data sources to help inform decision-making about the required number of stroke beds. We identified and visualised:
- Regions and referral sources of high demand
- Patient demographic and needs
- Problematic areas for readmissions
- Bed occupancy for stroke-related patients


The results
Using the evidence, we were able to recommend a minimum number of dedicated stroke beds required to meet the demand. Linking the hospital data to community data allowed a clearer understanding of patient after-care and the impact on readmissions. Key recommendations included:
- A threefold increase in dedicated stoke beds
- Changes to methods of data collection for improved accuracy
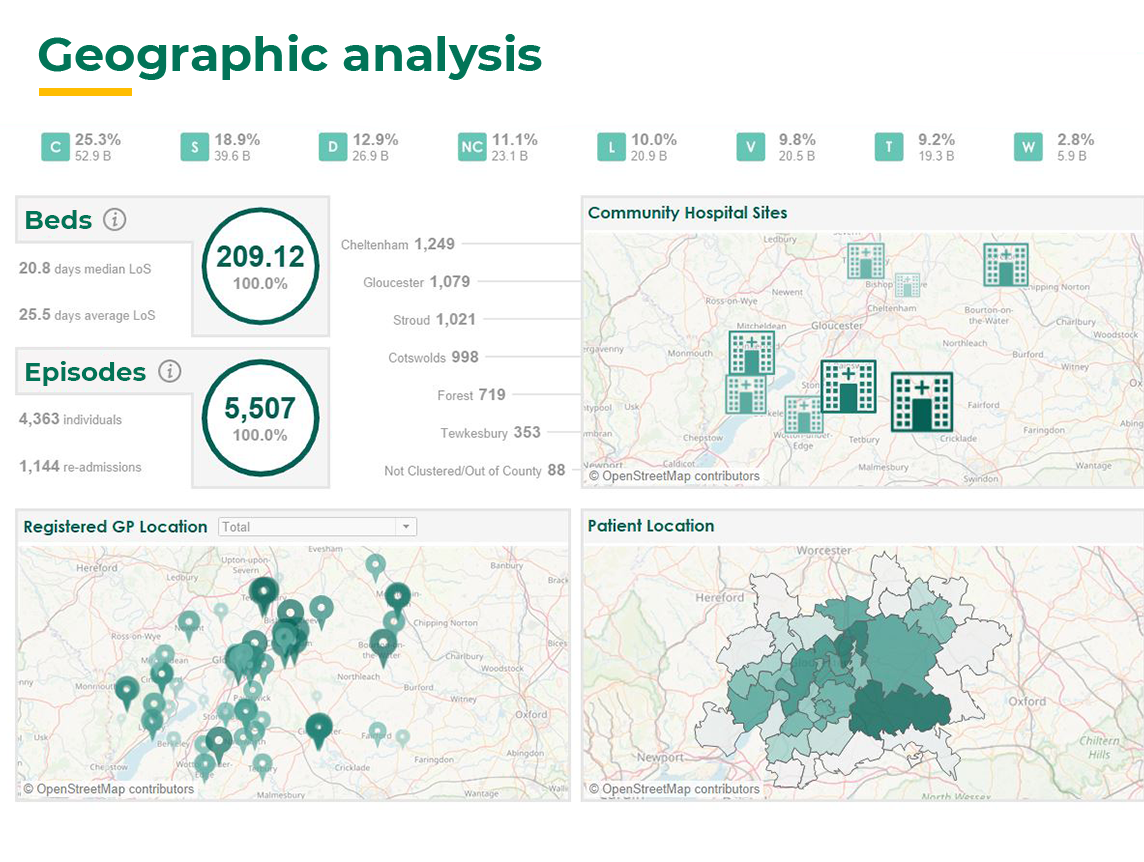
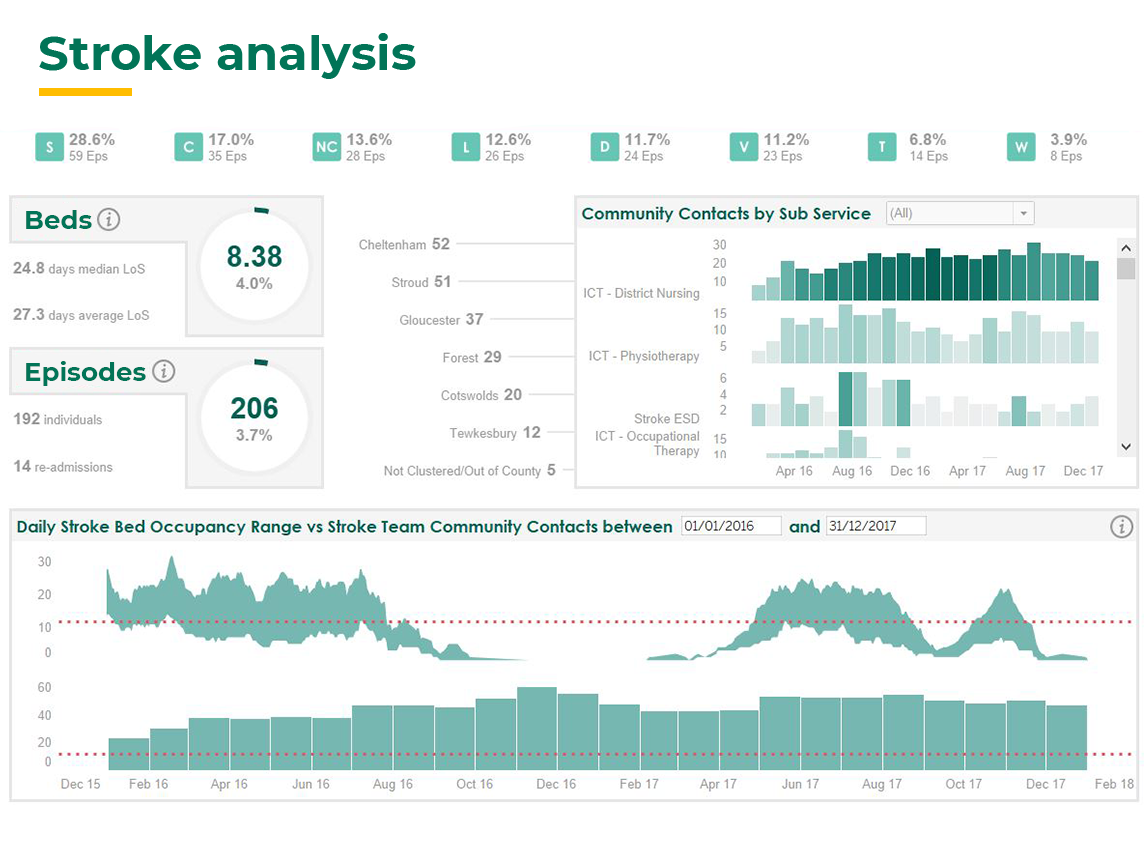
Our dashboards visualise the volume of care generated by hospital, patient location and GP and minimum and maximum number of beds occupied by patients with stroke symptoms based on ICD10 codes. The user can explore the data to easily understand which areas have the highest demand for different services. By plotting a line of best fit through the occupied bed ‘area’ we were able to recommended bed number based on analysis of a robust evidence-base.
Our visualisations allowed for informed decisions to be made when choosing locations for clinics or specialist services.
Our services
We offer a range of services that are designed to allow you to decide on the level and breadth of support
best suited to helping you meet your aims.
Education
Empowering you to harness local
knowledge and data to drive
effective and sustainable change.
Data analytics
We bring the experience and expertise to help organisations in transforming and visualising data.
Transformation
Innovative approaches that help healthcare
systems and services rethink delivery and create new models of care.
